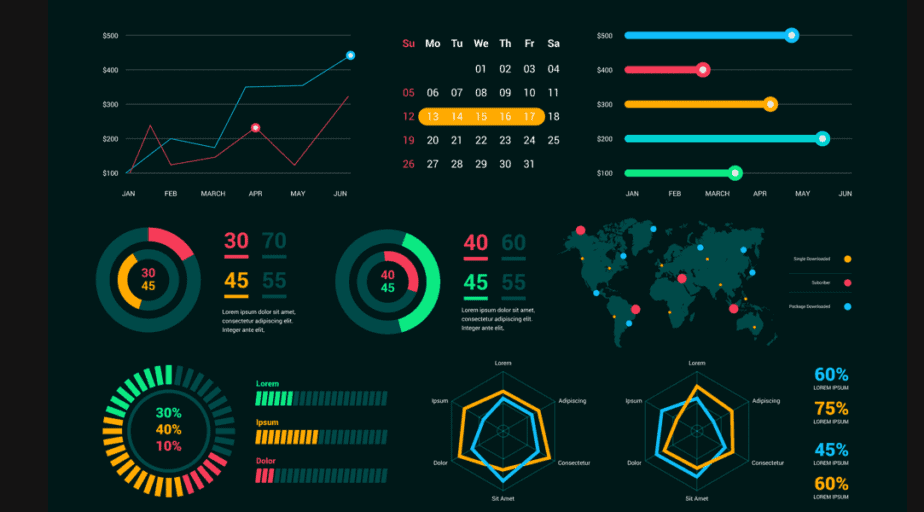
In today’s data-rich environment, the ability to effectively communicate financial information is more critical than ever. Data visualization has emerged as a powerful tool for US finance and accounting professionals to transform complex datasets into clear, concise, and compelling visuals that drive understanding and informed decision-making.
Key benefits of data visualization in US finance and accounting include:
- Enhanced Understanding: Visuals can make complex financial data more accessible and easier to grasp for a wider audience.
- Improved Insights: Patterns, trends, and anomalies that might be missed in spreadsheets can become readily apparent in charts and graphs.
- More Effective Communication: Visualizations can tell a story more powerfully than tables of numbers, facilitating better communication of financial performance and key messages.
- Faster Decision-Making: Clear and concise visuals can enable stakeholders to quickly identify key information and make timely decisions.
- Increased Engagement: Engaging visuals can capture and maintain the attention of the audience during presentations and reports.
From interactive dashboards to insightful charts, data visualization tools are becoming essential for finance and accounting teams in the US to effectively analyze and present financial information to management, investors, and other stakeholders.
How is your finance and accounting team in the US leveraging data visualization? What tools and techniques have you found most effective? Share your insights and examples!